March 15, 2020
2020-03-16
A new workspace.
I'm writing from Seattle, which you may potentially know as "the COVID-19 epicenter of the United States." I promise this will be the last mention of coronavirus in this newsletter, but I used my last "ignore social distancing at one's own peril" pass this past weekend to go to a ghost-town version of IKEA and upgrade my home office to one that fits both me and my partner:

This falls squarely into 'Ikea hack' territory, a content genre unto itself: our double desk is not so much a desk as it is three dressers and two kitchen countertops, a tactic we purloined from others. It is very pretty and very nice and I am more excited than ever to spend mornings and evenings in this lovely space.
There is something so pleasantly aspirational and metaphorical about a new office and a new desk. It reminds me a lot of a new codebase. Yes, things will get messy: your tray will pile up with the detritus of receipts and unused cables, your desk will get marred by coffee rings and soda stains. The cords, like poor abstractions, will grow knotty and unmanageable as soon as they become useful.
But right now it is very pleasant, even if it spent a Saturday afternoon hunch-backed building dressers.
Subscription cohort charts.
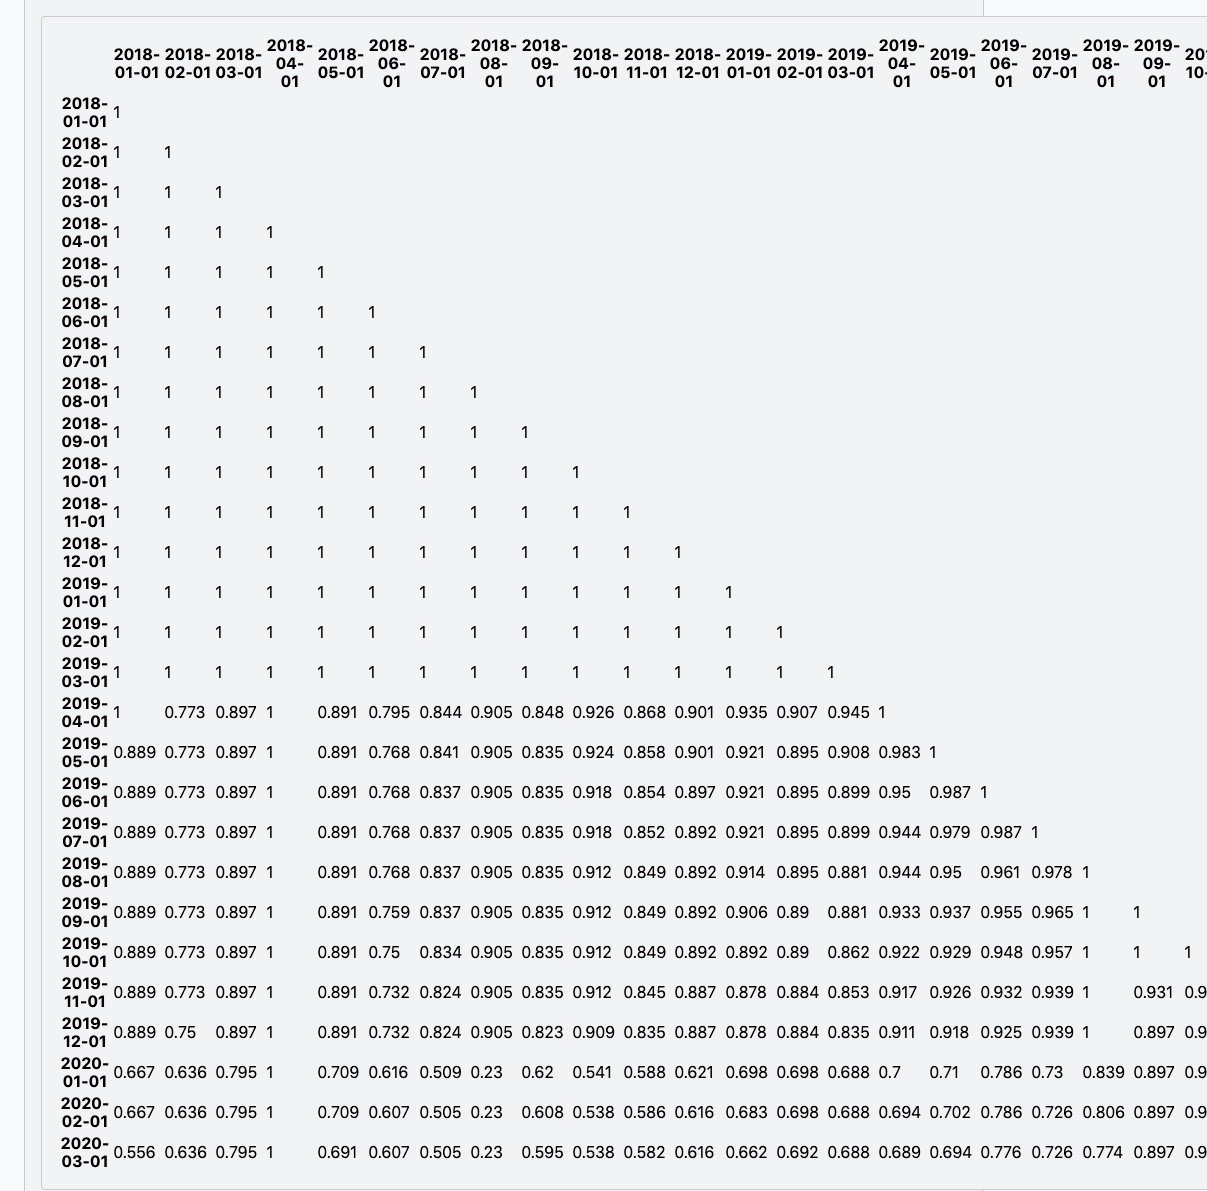
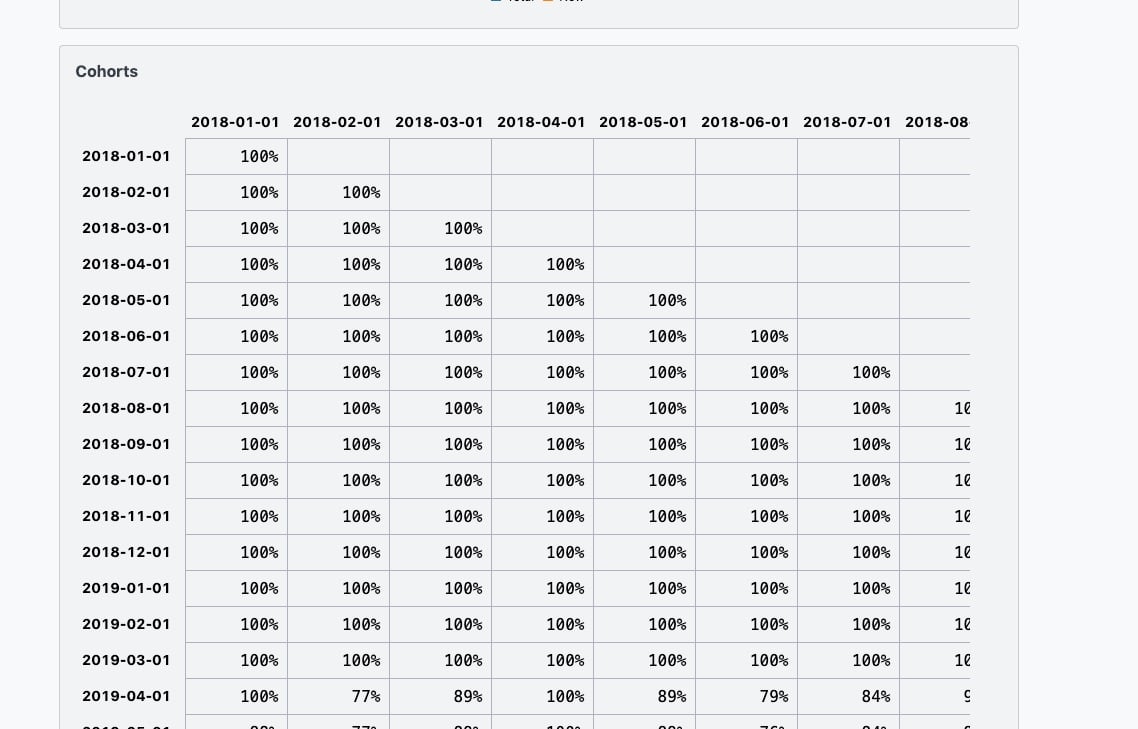
A feature that I succumb too easily to is that of the form "this is probably not going to help too many people but will be inoffensive and fun to build." March's version of that is subscription cohort charts, which plot subscriber drop-off bucketed by certain times. Here are some very gross WIP screenshots:


This is mostly a solved design problem (I'm biased, of course, but I really like Stripe's) and yet there are so many microdecisions to consider. Do I bucket by month or by week? Or by email? Do I keep it in sync with the overall timelines of the Analytics page or do I break it out? And so on.
This should, with any luck, go live this week, which is the first time (and hopefully not the last) I've touched Analytics in 2020. I'm very happy to have settled on a design pattern for these relatively complicated calculations, which is to offload everything to the server — a single API endpoint already returns the structured data that the frontend component can just munge into a table.
Updating the roadmap
In much the same way I spent last week updating the FAQ, I modernized Buttondown's roadmap a bit. It still needs some fleshing out and population but the Kanban-style feels like a better source of truth — and something that I can actually pull from, rather than using it as a lossy compression of my GitHub Issues list. (The big barrier, of course, is putting things like bug reports onto it — I suspect that I will start doing that, but people are going to see just how many random frontend bugs I end up dealing with on a day to day basis...)
Don't miss what's next. Subscribe to Weeknotes from Buttondown: