July 1, 2019
2019-07-02
Welcome to July! I'm happy to be back in Seattle after a brief sojourn in San Francisco (as promised/warned, very little got done besides reading Lanny and Middlemarch in various SoMa bars). And this week will be similarly truncated, with me spending the back half of the week in Whistler, Canada with my partner and her family.
Costs, except less so.

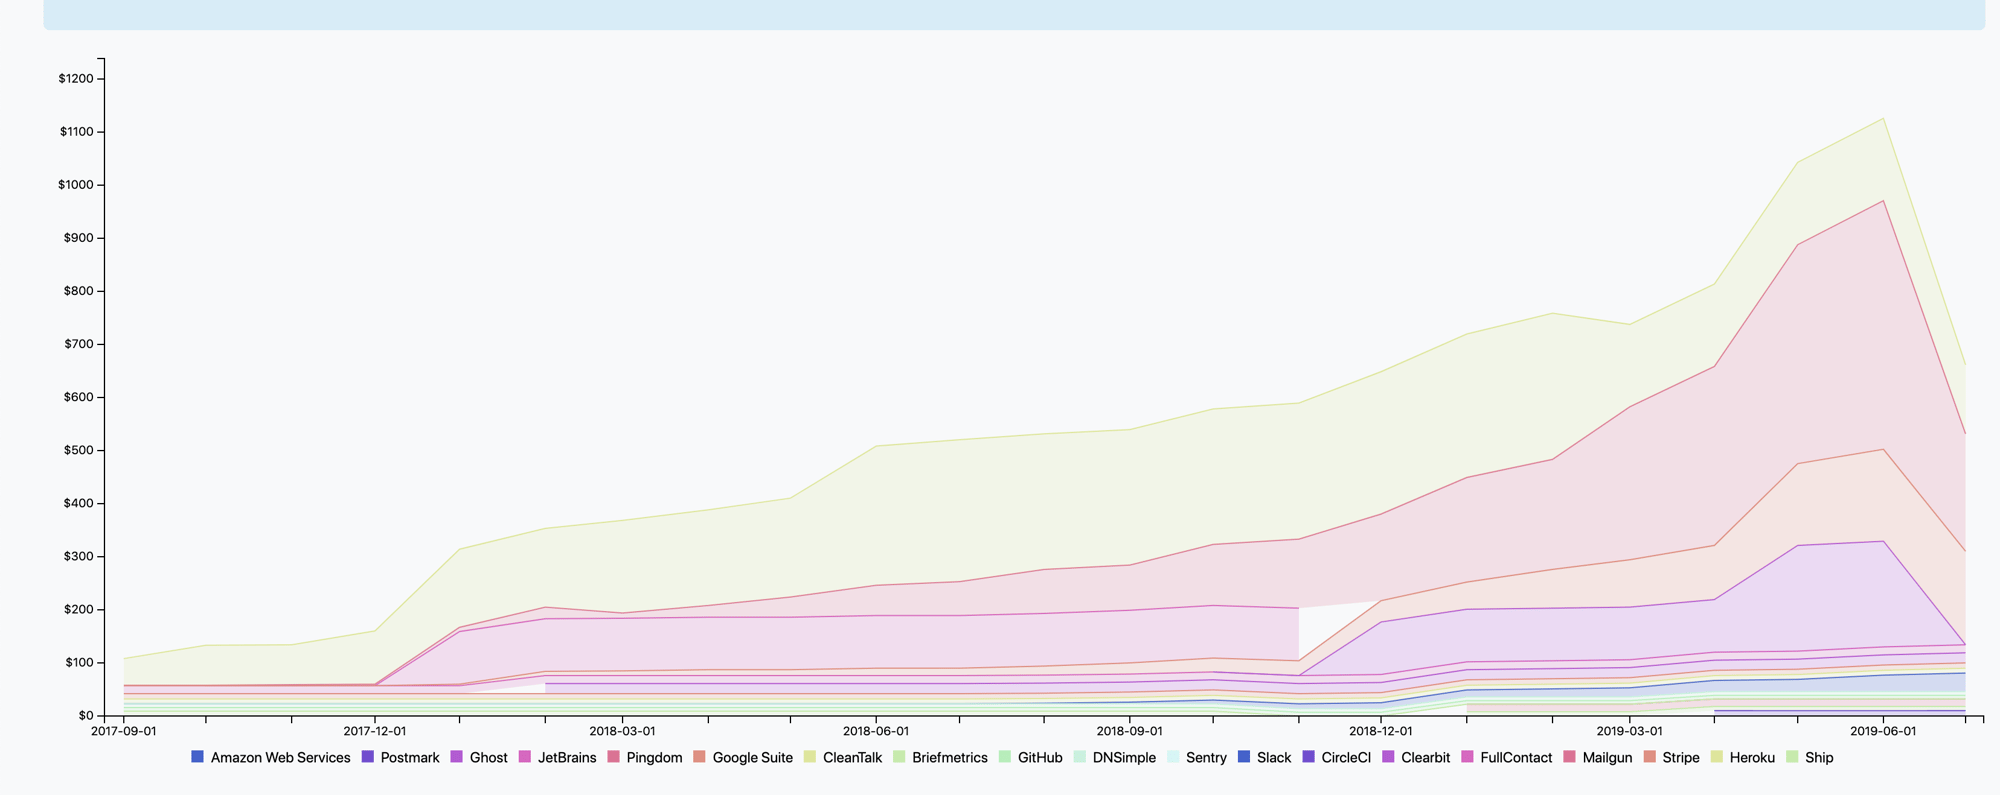
Look at that glorious image! That, my friends, is the culmination of a couple hours of fairly trivial work:
- Getting rid of my Clearbit costs altogether by shifting to a pass-through model for the handful of folks using it.
- Turning off Mailgun's pricy email validations and using a homebrew approach
- Tuning my Heroku setup somewhat.
I've cut Buttondown's costs in half over two months, which is really nice. There are a couple other things that are going to help here:
- I enrolled in Stripe's Atlas program (which really should be recorded as a cost), which comes with a whole bunch of free AWS credits.
- I'll bump up my Ghost integration to an annual fee, which will save me a couple bucks each month.
But that's it. This feels much more sustainable and realistic, and my per-subscriber margins are much healthier now.
Metrics?!
I have started to build a metrics dashboard (let's call this project Eyeglass). This is very exciting, even if its sort of a fools' errand: I don't think I check metrics very often, but I'm certainly doing it more than I was earlier this year, and it feels like a good forcing function to think of things more mechanically, looking at what parts of Buttondown are doing well and what are doing poorly.
(I am a big proponent of visualization as a means of action, as evidenced by the whole costs thing. 80% of the reason I noticed costs were growing unsustainably is because I finally plotted them out; 80% of the reason I spent effort driving them down is because I wanted to see the pretty graph go down.)
This act of building a metrics dashboard is, of course, a massive rabbit hole in of itself. It took me a week to settle on a tech stack — I'm using Plot.ly's Dash, because I can bundle it with Buttondown's main repo and because I have some familiarity with the graphing API — but then with each thing I want to graph I fall down a rabbit hole:
- How do I efficiently calculate rolling averages over ten million subscribers?
- How do I pull data from Mailgun around deliverability statistics?
- How do I host this thing, anyway?
There are lots of questions that have to be answered with time at the keyboard, which is a scary prospect for a thing that I will not use very often and definitely not be able to turn into a profit center. But it is fun and enlightening, which is worthwhile in of itself.
Marketing > features!
On a lark, I'm participating in IndieHackers' 30 days of growth campaign, which should either be lots of fun or something that I promptly abandon in three days. I've written the past few weeks about wanting to get more marketing-y, and this seems like perfect timing.
The additional twist I'm going to give for myself is that I'm not allowed to launch any features in July. There will be non-feature code written, sure — customer service-type things, bug fixes, and the like — but I need to turn off the part of my brain that only gets endorphins from fun things being added to the tool for a bit.
(Again, we'll see how long that actually lasts. But it feels like a noble aim.)
Don't miss what's next. Subscribe to Weeknotes from Buttondown: